
Consumption
Manage → Consumption shows how much the solution consumed, with filters and per-record detail.
The totals
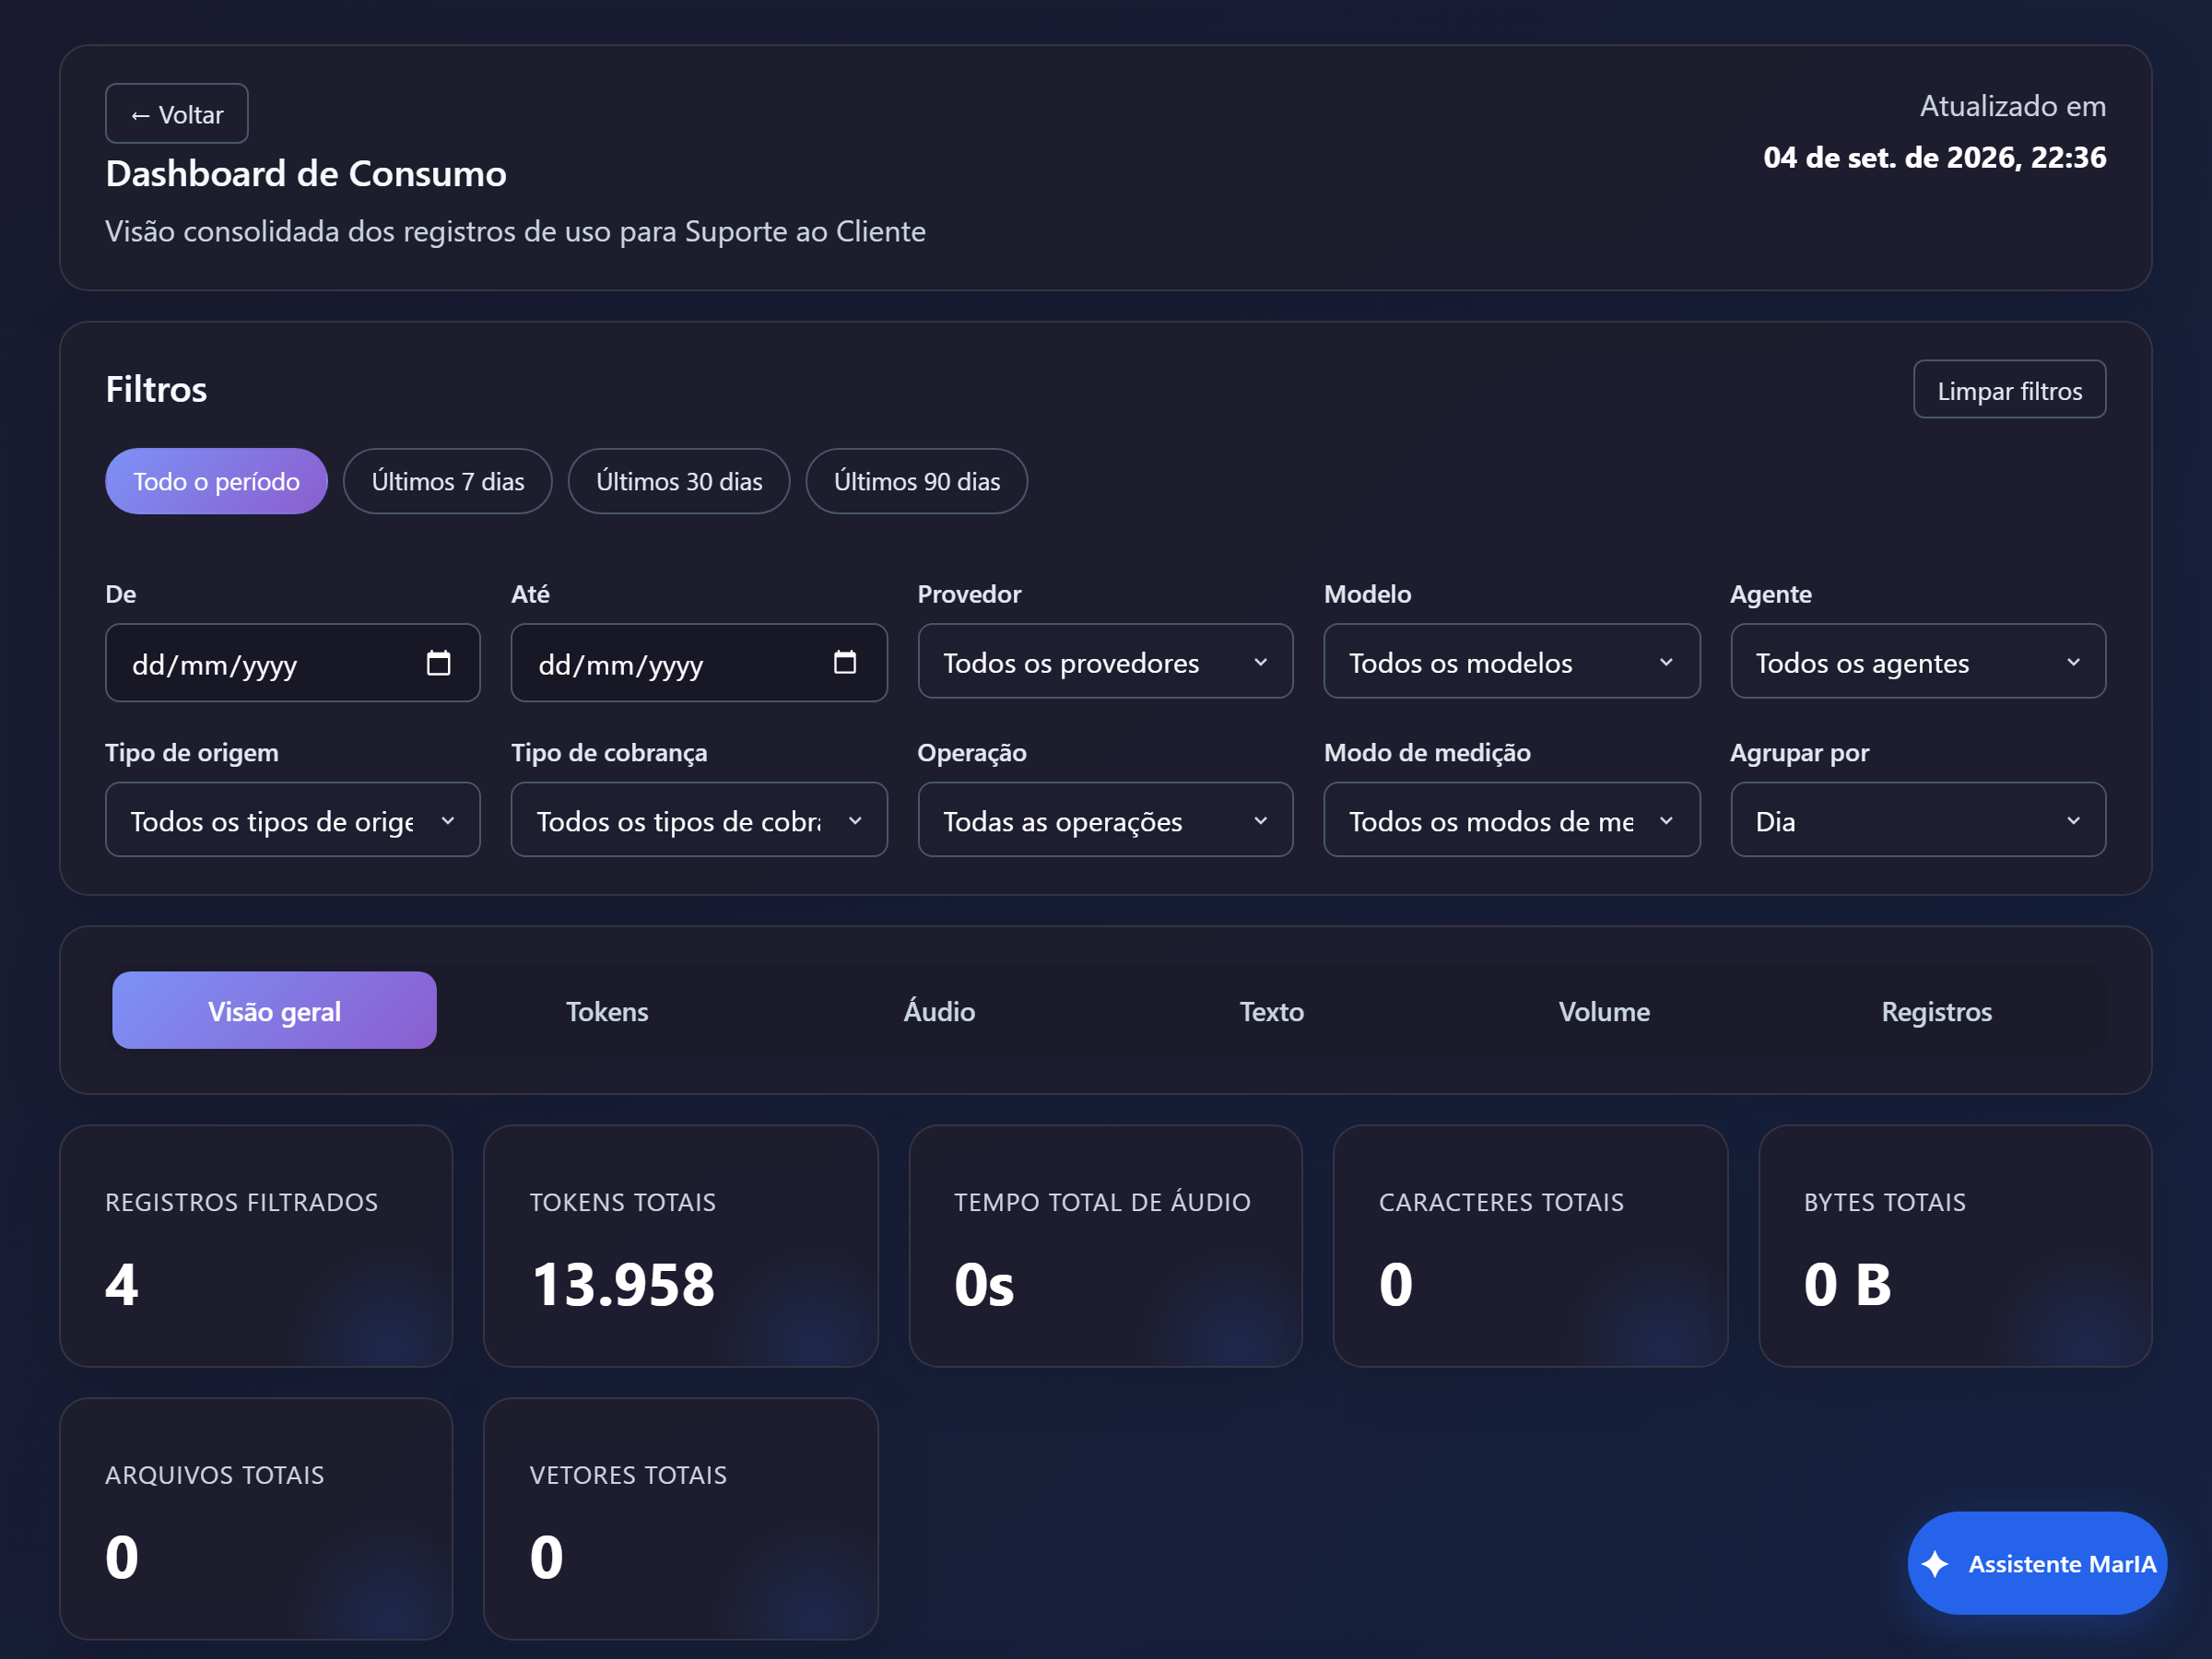
Section titled “The totals”The cards at the top summarise the filtered period:
| Card | What it counts |
|---|---|
| Filtered records | How many measurements fall inside the current slice |
| Total tokens | The volume of text processed by the models |
| Total audio time | Seconds of transcription and speech |
| Total characters | Used by charges measured in characters |
| Total bytes, Total files, Total vectors | Files processed and indexed |
A single conversation turn usually produces more than one record — the agent’s answer and the trace narration, for instance, appear separately.
The filters
Section titled “The filters”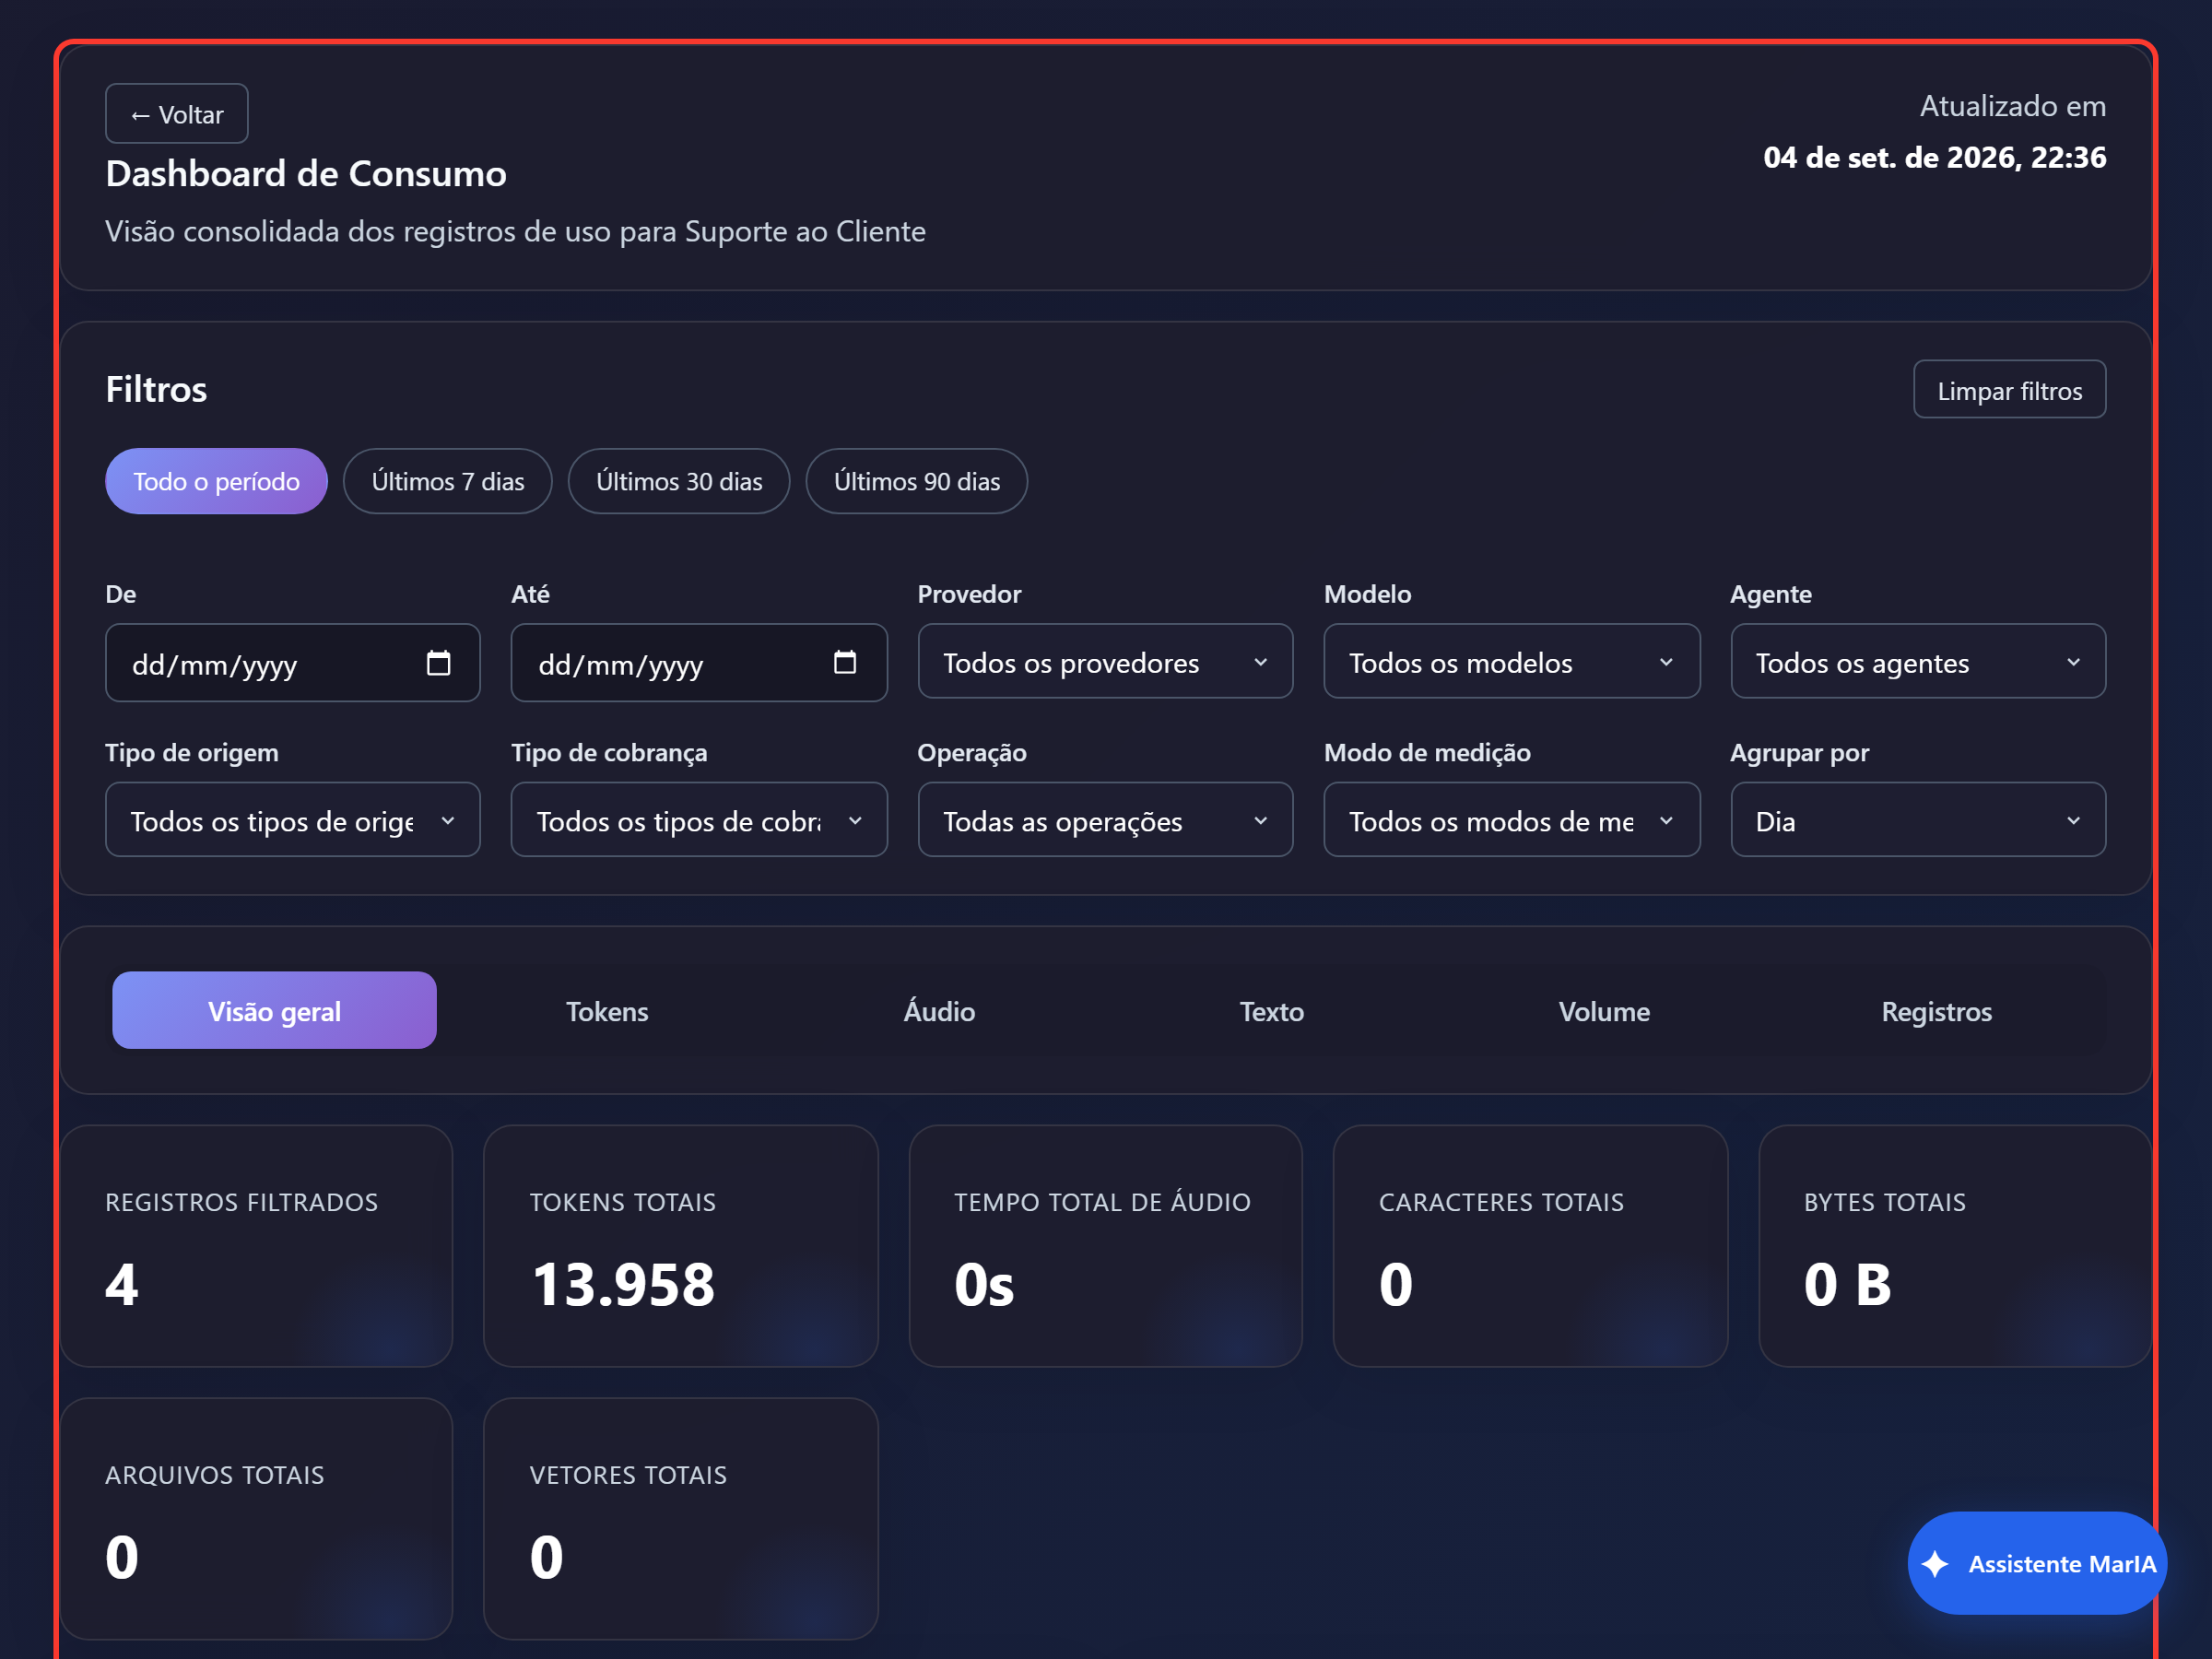
| Filter | Typical use |
|---|---|
| Period | All time, last 7, 30 or 90 days, or a From/To range |
| Provider and Model | Compare the cost of different models |
| Agent | Find out which agent concentrates the consumption |
| Source type | Separate what came from the agent and what came from trace narration |
| Charge type | Tokens, audio, characters, files |
| Operation | The kind of call made to the provider |
| Measurement mode | Whether the number was reported by the provider or computed by MarIA |
| Group by | Day, week or month on the timeline |
Clear filters returns to the full view.
The detail tabs
Section titled “The detail tabs”Below the charts, the Overview, Tokens, Audio, Text, Volume and Records tabs go deeper into each dimension. Records is the most granular one: it lists measurement by measurement, which is what you need when you have to explain a spike.
How to investigate a rise in consumption
Section titled “How to investigate a rise in consumption”- Filter the period where the rise appeared and group by Day.
- Filter by Agent to find where it is concentrated.
- Look at Source type: high trace-narration consumption usually points to multi-agent orchestration with too many participants per turn.
- Check, in Orchestration, the Max Participant Runs per Turn and the model used for narration.